A business can finish the month with more customers than it started with and still be losing regulars.
Imagine a service business starts with 100 active customers, gains 20 new ones and finishes with 110. The overall customer count has grown, which looks encouraging. But ten existing customers have also disappeared.
New business is covering the loss. Without looking at customer retention, the owner might never notice.
This is why customer retention metrics deserve a place alongside sales and revenue figures. They reveal whether customers return, how their buying habits change and whether the business is building relationships that support sustainable growth.
You don’t need expensive reporting software to find these answers. A reliable customer list, transaction history and a few consistent calculations can tell you plenty.
Jump to the section you need
Quick Overview
The most useful customer retention metrics answer three questions: Are existing customers staying or returning? How frequently do they buy? And how much value does that repeat business contribute?
Customer retention rate, repeat purchase rate, purchase frequency, customer lifetime value and returning customer revenue are useful starting points. Customer churn and service feedback provide additional context.
The right combination depends on what you sell and how regularly customers are expected to need it. A café, an online retailer and a consulting business should not measure loyalty on identical timelines.
First, Decide What Counts as a Returning Customer
Before calculating anything, decide what a customer must do to qualify as active or returning.
For a subscription service, it may be straightforward: a customer remains active while their subscription continues.
For an online retailer, a returning customer is someone who makes another purchase after their first order.
A landscaping business is different again. A customer might book a substantial project and have no reason to return for several months. A lack of repeat bookings within 30 days would not necessarily indicate a problem.
Define the expected buying cycle before choosing your reporting period.
Also, distinguish customers from transactions. One person placing five orders is still one customer, even though those orders contribute five sales.
Where possible, use a consistent customer identifier, such as a customer ID within your sales system, to avoid counting the same person more than once.
Measure Whether Existing Customers Are Staying
Customer Retention Rate
Customer retention rate shows the percentage of customers a business keeps over a defined period, excluding newly acquired customers.
It’s particularly useful for memberships, subscriptions, ongoing service arrangements and businesses that can clearly identify an active customer base.
Formula:
Customer Retention Rate = ((Customers at End − New Customers) ÷ Customers at Start) × 100
Return to our hypothetical service business:
- Customers at the start: 100
- New customers acquired: 20
- Customers at the end: 110
- Existing customers retained: 90
The calculation is:
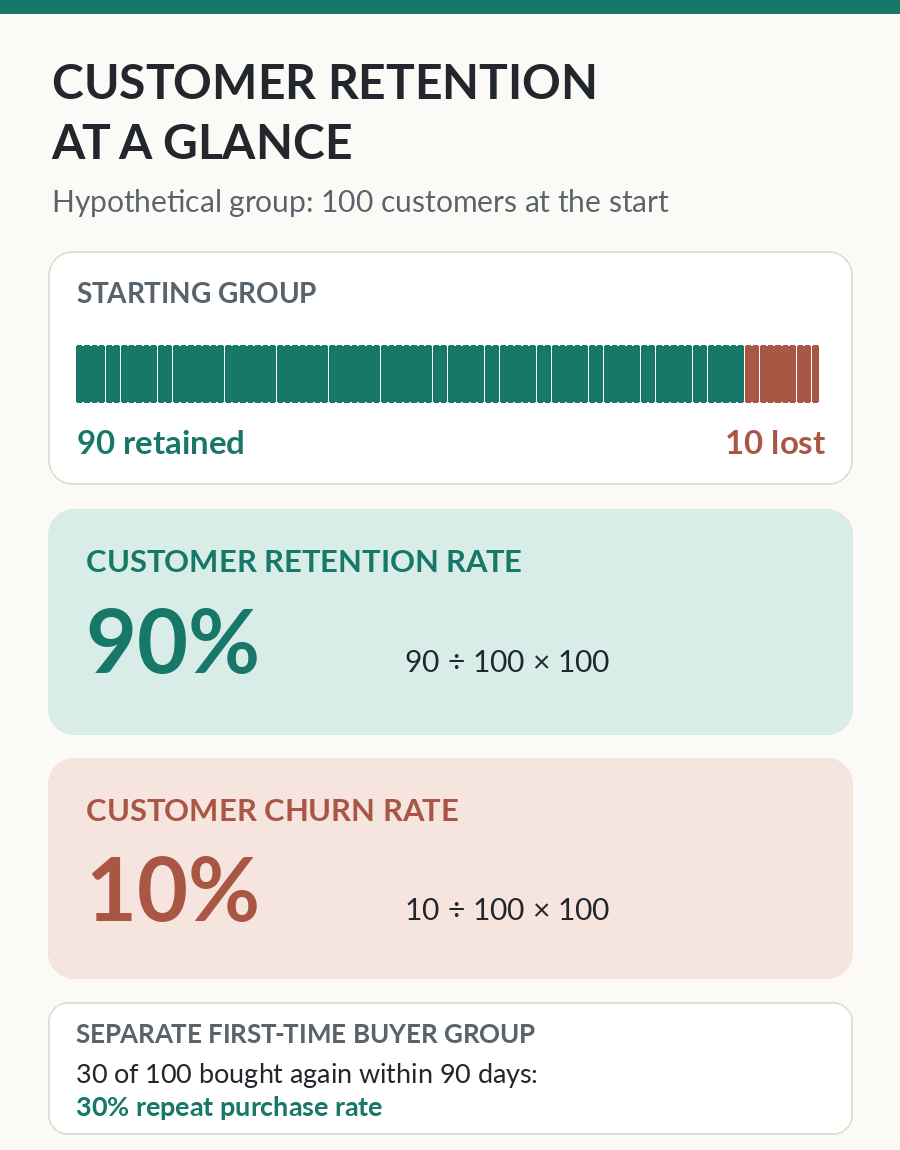
(110 − 20) ÷ 100 × 100 = 90% retention
In this example, the business retained 90 of its original 100 customers.
The formula works when customer counts, new-customer definitions and activity rules are consistent. For businesses where customers buy irregularly, measuring the original customer group directly may provide a more useful picture.
Square Australia’s guide to customer retention explains the standard calculation and how businesses can use it.
Customer Churn Rate
Customer churn measures the proportion of existing customers lost during a reporting period.
For the same customer group, using consistent definitions, churn is the opposite of retention.
Formula:
Customer Churn Rate = (Customers Lost ÷ Customers at Start) × 100
In our example, ten of the original 100 customers were lost.
10 ÷ 100 × 100 = 10% churn
A rising churn rate deserves attention, especially if new sales are masking the decline.
However, don’t assume every departing customer has had a poor experience. Customers may leave because their circumstances change, a project ends or they no longer need the service.
For businesses without subscriptions or contracts, define what makes a customer inactive before using churn. A customer who has not purchased for 60 days might be lost to a weekly delivery service but perfectly normal for an annual maintenance provider.
Look Beyond the First Sale
Repeat Purchase Rate
Repeat purchase rate is especially useful for retailers, hospitality businesses and other businesses that depend on customers making additional purchases.
It answers a practical question: how many people who bought from us once came back for another purchase?
One useful approach is to follow a group of first-time buyers over a fixed period.
Formula:
Repeat Purchase Rate = (First-Time Customers Who Buy Again ÷ First-Time Customers in the Group) × 100
Suppose 100 customers make their first purchase during a particular month. Within the following 90 days, 30 make at least one additional purchase.
The group’s 90-day repeat purchase rate is 30%.
Tracking the same period for successive groups can show whether improvements to products, service or follow-up communication are associated with more repeat business.
Make sure every group has had the full 90 days to return before comparing results. Otherwise, newer customer groups will appear weaker simply because they have had less time.
Some reporting systems instead show the percentage of all customers who placed multiple orders during a particular reporting window. That can also be useful, but it is a different calculation. Label the measure clearly and avoid switching definitions between reports.
Time Between Purchases
Knowing that customers return is useful. Knowing when they return can make the information more actionable.
A business selling consumable products may notice that repeat orders commonly occur after several weeks. A business providing specialist maintenance may have a much longer interval.
Track the number of days between a customer’s first and second purchase, or between successive purchases.
A median interval can be helpful because a few unusually long gaps may distort a simple average.
For example, suppose repeat customers typically make their second purchase around six weeks after their first. That pattern may help the business decide when to send useful product information, service reminders or replenishment notices.
The aim is to contact customers when the message is relevant, rather than automatically sending more promotional emails.
Purchase Frequency
Purchase frequency measures how many orders the average customer makes during a defined period.
Formula:
Purchase Frequency = Total Orders ÷ Unique Customers
If a store records 600 orders from 300 individual customers over six months, its purchase frequency is:
600 ÷ 300 = 2 orders per customer
Compare the figure over consistent periods and, where useful, examine new customers separately from established ones.
An increase can be encouraging, but it needs context. A customer placing several small orders may generate less profit than one customer making a substantial purchase.
That’s why purchase behaviour should be reviewed alongside financial measures.
Check Whether Repeat Business Is Commercially Valuable
Returning Customer Revenue
A business might have a healthy number of repeat customers while receiving most of its income from first-time buyers.
Returning customer revenue helps explain the balance.
Formula:
Returning Customer Revenue Share = (Revenue From Returning Customers ÷ Total Revenue) × 100
Imagine a retailer generates $50,000 in sales during a month, with $22,000 coming from customers who had purchased previously.
Returning customers contributed 44% of revenue.
This does not mean 44% of customers were returning customers. Revenue share and customer share measure different things.
To calculate it accurately, decide whether a customer is classified based on purchases made before the reporting period or whether later orders within the same period count as returning-customer revenue. Use that rule consistently.
Watch how the proportion changes as your business grows. A successful campaign attracting many new customers may temporarily reduce the returning-customer revenue share, even while repeat sales increase in dollar terms.
The percentage is a signal to investigate, not a score that always needs to rise.
Customer Lifetime Value
Customer lifetime value, or CLV, estimates the financial value a customer generates over the course of their relationship with a business.
For small businesses, it helps connect retention with longer-term commercial decisions.
A simplified gross-profit estimate is:
Estimated CLV = Average Gross Profit per Purchase × Expected Purchases per Year × Expected Customer Lifespan in Years
Suppose a customer generates $40 in gross profit per purchase, buys four times per year and is expected to remain a customer for three years.
$40 × 4 × 3 = $480 estimated lifetime gross profit
This is a hypothetical estimate, not a guaranteed return.
It also isn’t necessarily the customer’s net lifetime contribution. Marketing expenses, account management, customer support and other costs may need to be considered separately, depending on what the business wants CLV to represent.
For a newer business with limited historical information, customer lifespan can be difficult to estimate. Use conservative assumptions and update them as more actual purchasing data becomes available.
CLV becomes particularly useful when comparing customer groups. A customer who buys repeatedly at full price may contribute more than one who purchases frequently only during heavily discounted promotions.
Find Out Why Customers Return — or Stop Returning
Sales records show what customers do, but they rarely explain the complete reason.
A customer might stop purchasing because delivery became unreliable, prices changed, a competitor offered something more suitable or the original problem was already solved.
Customer feedback can help investigate these possibilities.
Useful service indicators include:
- Complaint rate: The proportion of orders or customers associated with complaints, using a clearly defined denominator.
- Resolution time: How long it takes to resolve customer problems.
- Cancellation reasons: The main reasons customers give when ending subscriptions or ongoing agreements.
- Customer satisfaction: Feedback collected after a purchase, service or support interaction.
A small business doesn’t need to adopt every survey method immediately. A short, relevant question at the right point can be more informative than a long questionnaire that few customers complete.
Review feedback together with purchasing behaviour. If customers who report delayed deliveries also stop ordering, the business has a specific issue to investigate.
The Australian Government’s guidance on managing customer relationships recommends maintaining customer records, gathering feedback and reviewing service performance.
Collect only the customer information you reasonably need and manage it in accordance with applicable privacy requirements.
Match the Metrics to Your Business Model
Not every retention metric deserves equal attention in every industry.
For retail and e-commerce
Start with repeat purchase rate, time to second purchase, purchase frequency and returning customer revenue. These reveal whether first-time buyers are developing into regular customers and whether repeat orders contribute meaningfully to sales.
For subscription and membership businesses
Prioritise customer retention rate, churn rate and recurring revenue lost through cancellations or downgrades. Track new subscriptions separately so customer acquisition doesn’t conceal customer losses.
For professional services and trades
Review repeat bookings where repeat work is naturally expected, client renewal or contract continuation, returning-client revenue and service feedback. A project-based customer may also return through referrals rather than another direct booking.
For cafés, salons and other appointment-based businesses
Visit frequency, repeat bookings and the time since a customer’s last visit can be particularly useful. Compare patterns across comparable customer groups instead of assuming all customers should attend at the same frequency.
The aim is to select measures that reflect normal customer behaviour, not to make every business fit the same dashboard.
Build a Monthly Retention Review Without Complicated Software
A simple reporting routine can be more useful than a large dashboard nobody checks.
Start with a spreadsheet or the reporting features already available in your booking, payment or customer management system.
For each reporting period, record:
- Customer activity: How many identifiable customers purchased, booked or remained active?
- Returning behaviour: How many came back, and how does that compare with a similar earlier customer group?
- Financial contribution: How much revenue and, where possible, gross profit came from returning customers?
- Customer feedback: What recurring complaints, cancellations or service issues appeared?
- Next action: What one change will the business make, and when will its effect be reviewed?

You may need to track different measures weekly, monthly or quarterly depending on the frequency of purchases. Keep the main definitions and observation windows stable.
An Example of Turning Numbers Into Decisions
Consider a hypothetical online homewares retailer.
Its 90-day repeat purchase rate declines from 32% for one first-time customer group to 24% for a later, comparable group.
That difference deserves investigation, but the percentage alone doesn’t explain the cause.
The business could check whether the product mix changed, whether customers received their orders on time, whether delivery complaints increased and whether a larger proportion of new customers purchased one-off gifts.
Suppose the analysis identifies a rise in delivery-related complaints among the newer group. The next sensible action may be to address fulfilment problems before offering discounts to encourage customers back.
The retailer can then compare the repeat purchase behaviour of subsequent customer groups after the operational changes.
This approach creates a direct connection between measurement, business decisions and outcomes.
Avoid These Common Measurement Mistakes
Counting orders instead of individual customers
Several transactions from one buyer should not automatically be treated as several retained customers. Keep transaction counts and customer counts separate.
Comparing customers with different buying cycles
A customer who buys groceries every week behaves differently from someone who commissions a building inspection or books an annual service.
Choose comparison periods that reflect the product or service.
Ignoring seasonal changes
Holiday trading, school holidays, annual renewals and promotional periods may influence repeat purchases. Compare similar periods or customer groups before drawing conclusions.
Treating every increase as a success
Higher purchase frequency is not necessarily better if it depends on excessive discounts or drives up servicing costs.
Review retention measures alongside revenue, gross profit and customer experience.
Measuring without making changes
The purpose of customer retention metrics isn’t simply to produce another report.
Each review should help identify what is working, what needs investigation and which action is worth testing.
Make Retention Part of Your Growth Strategy
Customer retention should sit alongside new customer acquisition rather than compete with it.
A business needs to attract new customers, but it also needs to understand whether those customers receive enough value to return.
Start with a few measures you can calculate reliably. Establish a baseline, compare similar customer groups and investigate meaningful changes before adjusting your approach.
Retention data can also inform referral activity. Customers with a consistently positive experience may be willing to recommend a business to others. For practical ideas, see our guide to setting up a customer referral programme.
The Australian Government also outlines practical ways to build customer loyalty, including improving service, seeking feedback and maintaining useful communication.
Ultimately, a good retention report should help a small business answer a straightforward question: Are we giving customers a reason to come back, and can we see that reflected in their actual behaviour?
If the answer is becoming clearer each month, the measurements are doing their job.